Synthetic Aperture Radar (SAR)
The Synthetic Aperture Radar o SAR is a microwave radar remote sensing system that allows to acquire Earth images independently of cloud cover and sunlight. The project used Second Generation COSMO-SkyMed (Constellation of small Satellites for the Mediterranean basin Observation) data. COSMO-SkyMed is an Earth Obeservation mission commissioned and funded by the Italian Space Agency (ASI) and the Italian Ministry of Defence
COSMO-SkyMed First Generation (CSK) consists of four Low Earth Orbit mid-sized satellites, each equipped with a multi-mode high-resolution Synthetic Aperture Radar (SAR). The system is operative since 2010 and It is completed by Ground infrastructures for managing the constellation and ad-hoc services for collection, archiving and distribution of remote sensing data.
COSMO-SkyMed second generation (CSG) is based on 2 SAR Satellites enhanced in terms of spatial resolution and data storage capacity and data transfer.
The ground displacement maps for the study area were obtained through multi-temporal interferometry algorithms on data covering a 48 months period. The COSMO-SkyMed SAR instrument can acquire a scene in three different modes:
- -SPOTLIGHT (mode 2 and mode 1) (mode 1 is for Defence use only).
- -STRIPMAP (HIMAGE and PINGPONG).
- -SCANSAR (WIDE REGION or HUGE REGION).
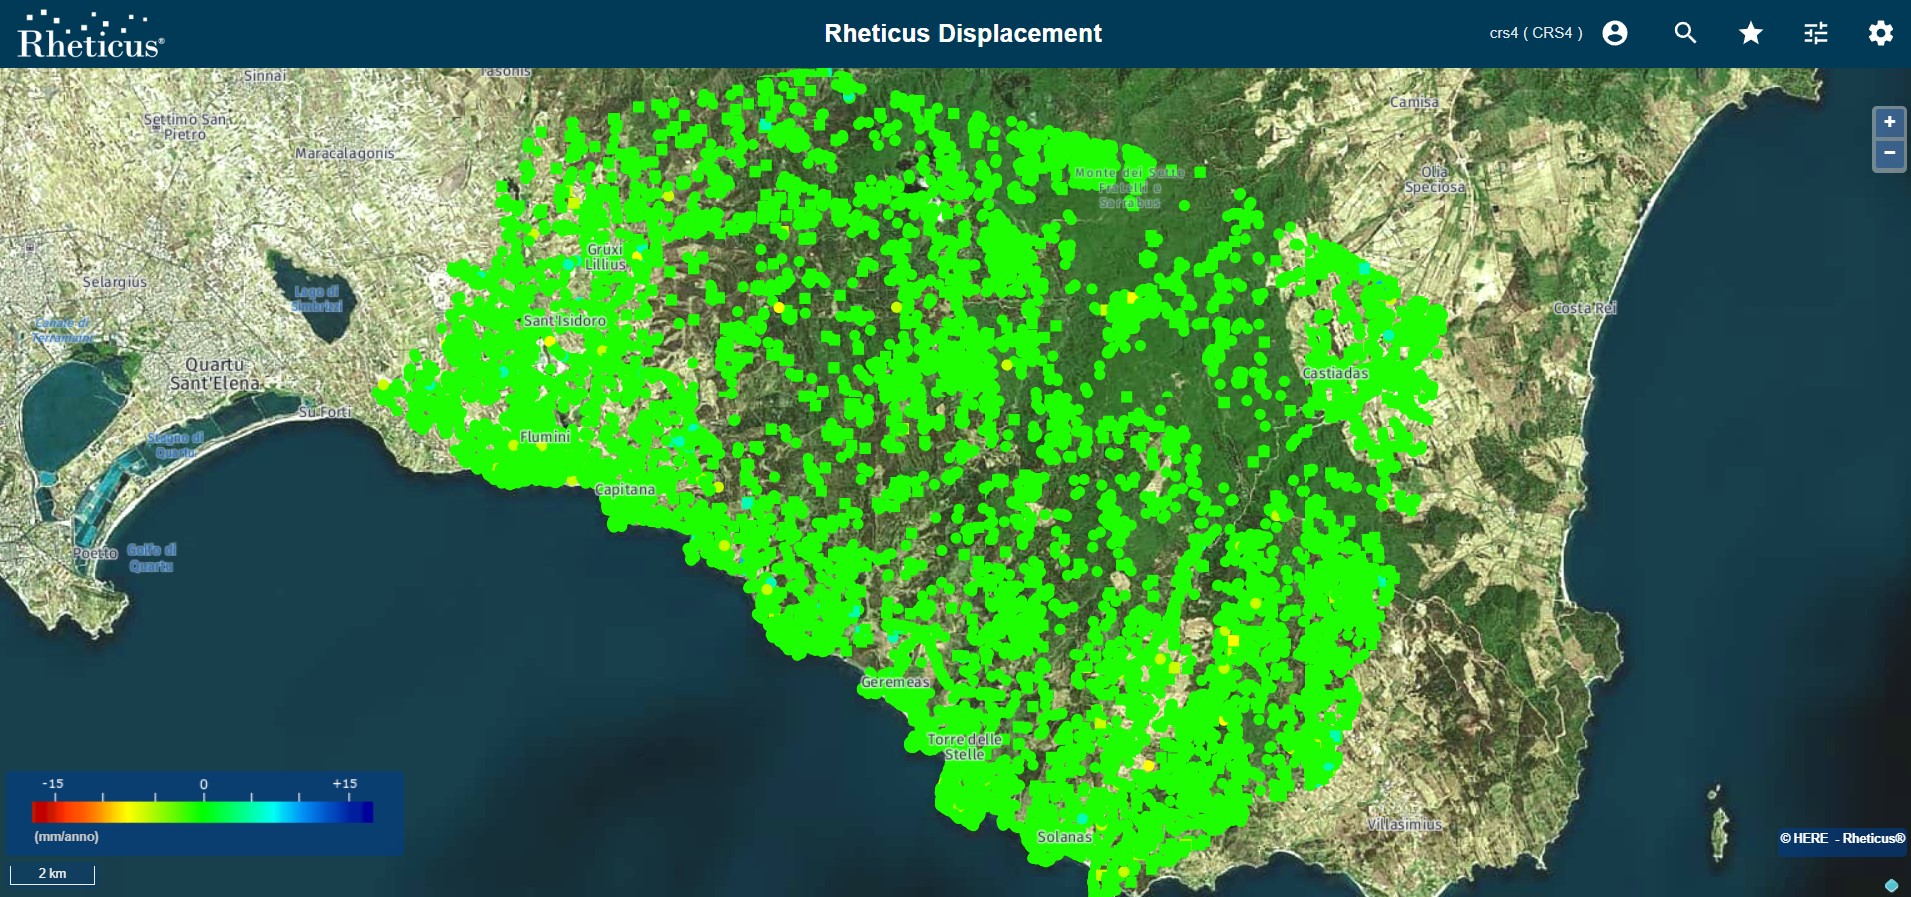
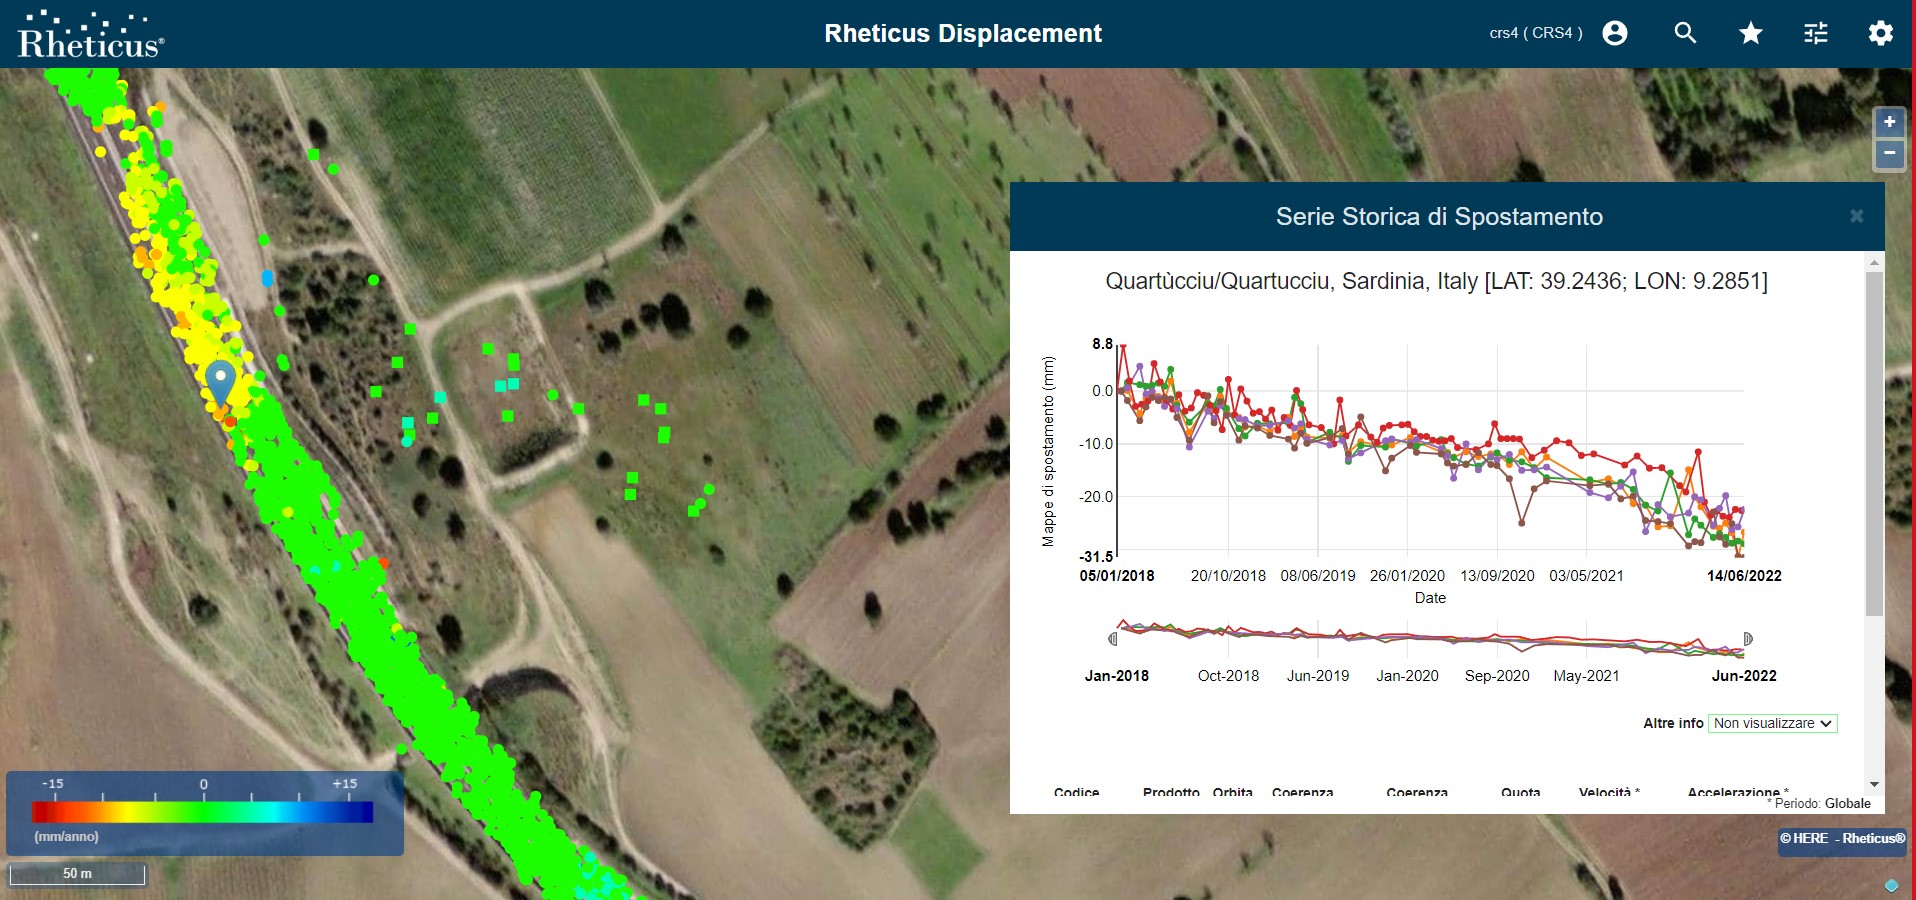
Multi-Temporal Interferometric (MTI) analysis over the area of Interest is provided through the cloud-based Rheticus® Displacement. Rheticus® is a cloud-based platform that provides geo-information services and It is a registered trademark of Planetek Italia. To derive the ground motion maps the COSMO-SkyMed images of each geometry (Ascending and Descending) acquired over the area were processed. In particular, the ground motion maps are obtained through Multi-Temporal Interferometric algorithms, processed over an historical period of 48 months. In the figure the Rheticus® Displacement web interface and the visualization of a time series.