The geophysical survey was performed by the Department of Civil, Environmental and Architecture of the University of Cagliari (DICAR) by the team of Prof. Giam Piero Deidda
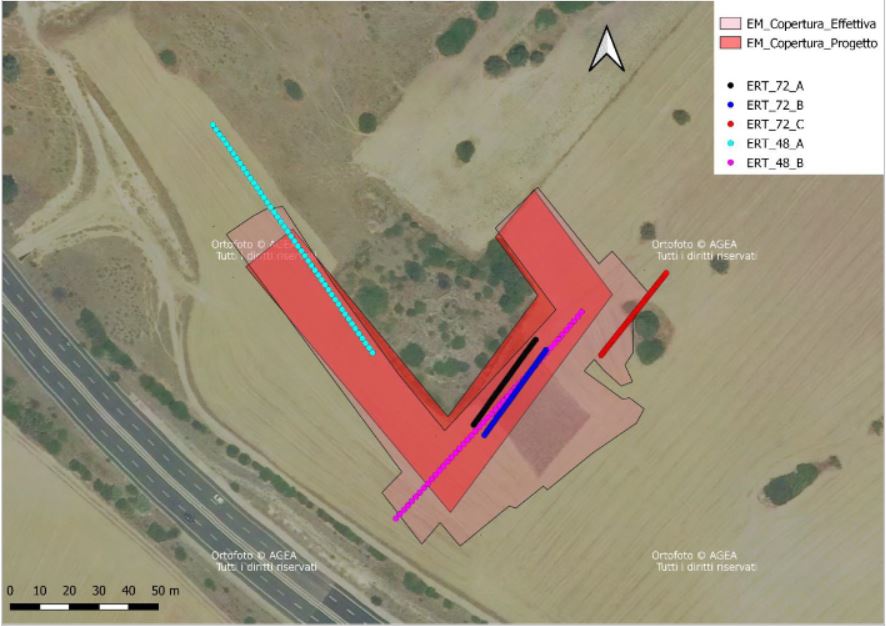
Two geophysical survey methods have been used: the geoelectric resistivity tomography and the frequency domain electromagnetic induction. The following image shows the areas where the data were acquired.
Geoelectric data acquisition
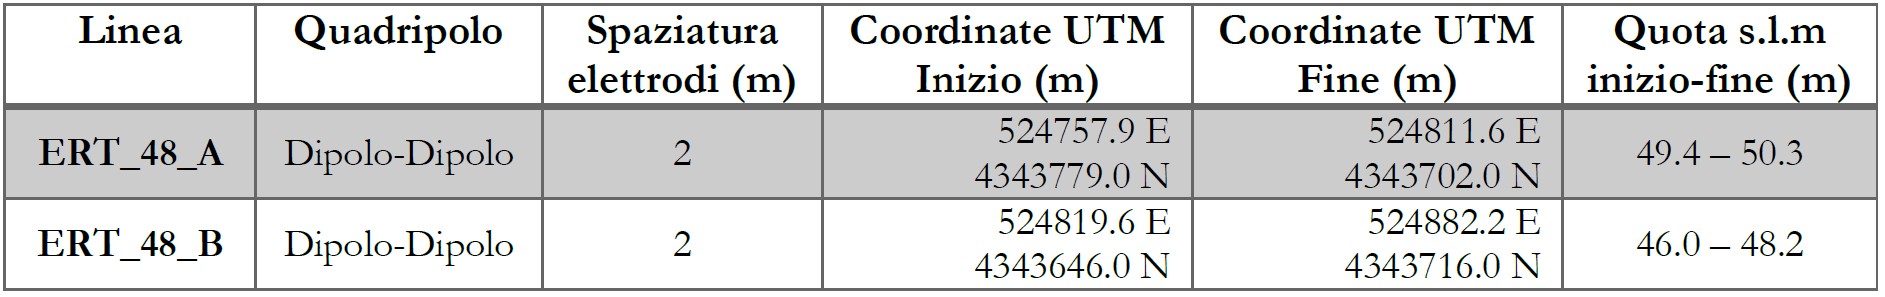
The geoelectrical survey has been conducted in two successive phases. In the first phase two profiles (ERT_48_A and profile ERT_48_B), have been acquired, with the main purpose to determine the average values of electrical resistivity, useful for the design of the electromagnetic survey. Both profiles were carried out with 48 electrodes, with a distance of 2 m, using the quadripole configuration of the Dipole-Dipole type, quadripole being more sensitive to horizontal (lateral) variations in electrical resistivity along the direction of the acquisition profile. The following table shows the geometrical details (spacing between electrodes, UTM coordinates and elevation at the beginning and end of the profile) and the quadripole type of each profile.
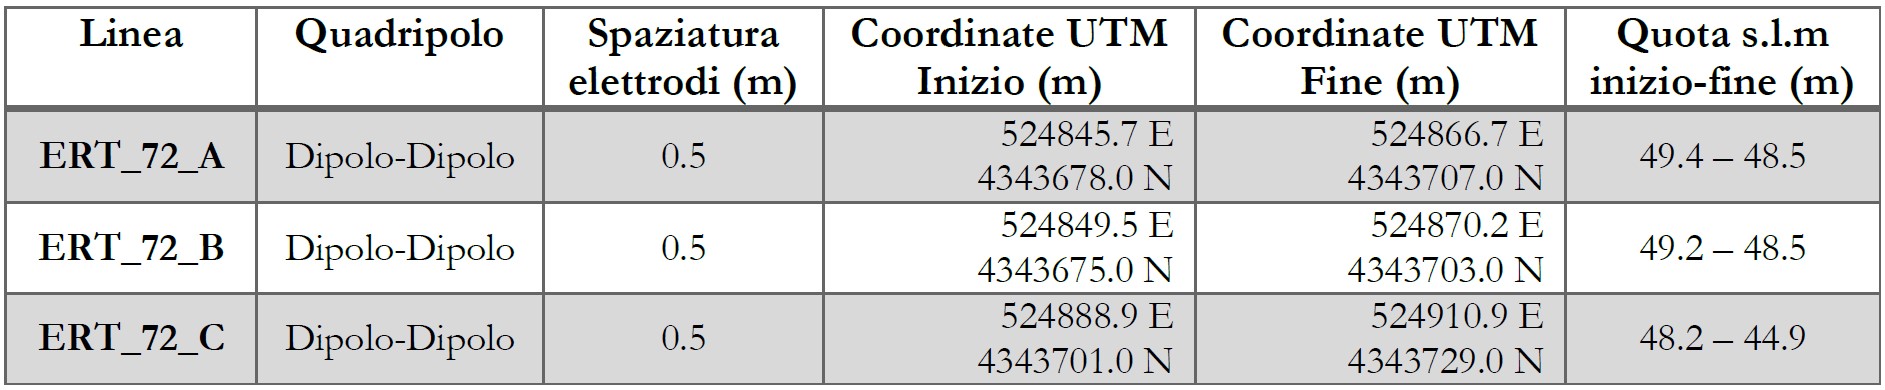
In the second phase, which took place after the electromagnetic survey have been acquired three profiles ERT_72_A, ERT_72_B e ERT_72_C, in order to verify electromagnetic anomalies. The profiles consisted of 72 electrodes, with a distance of 0.5 m, using the quadripole configuration of the Dipole-Dipole type. The following table shows the geometrical details and quadripole type of each profile.
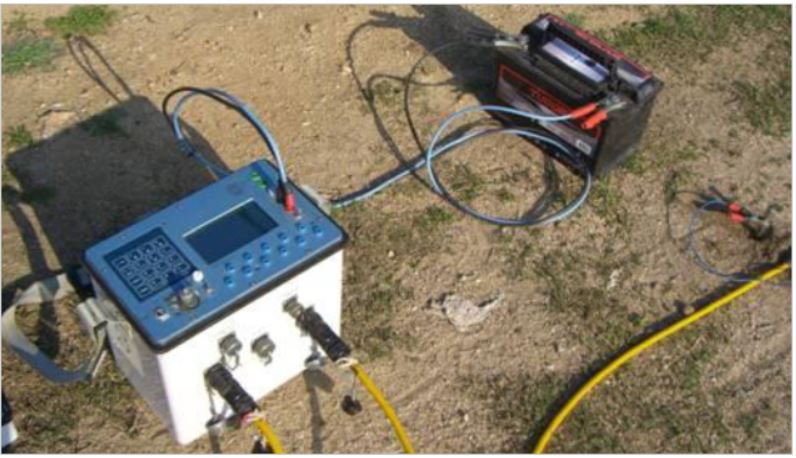
Apparent resistivity data have been acquired with an IRIS SyscalPro georesistivimeter with 10 physical channels programmed with Dipole-Dipole and Wenner-Schlumberger sequences.
Electromagnetic data acquisition
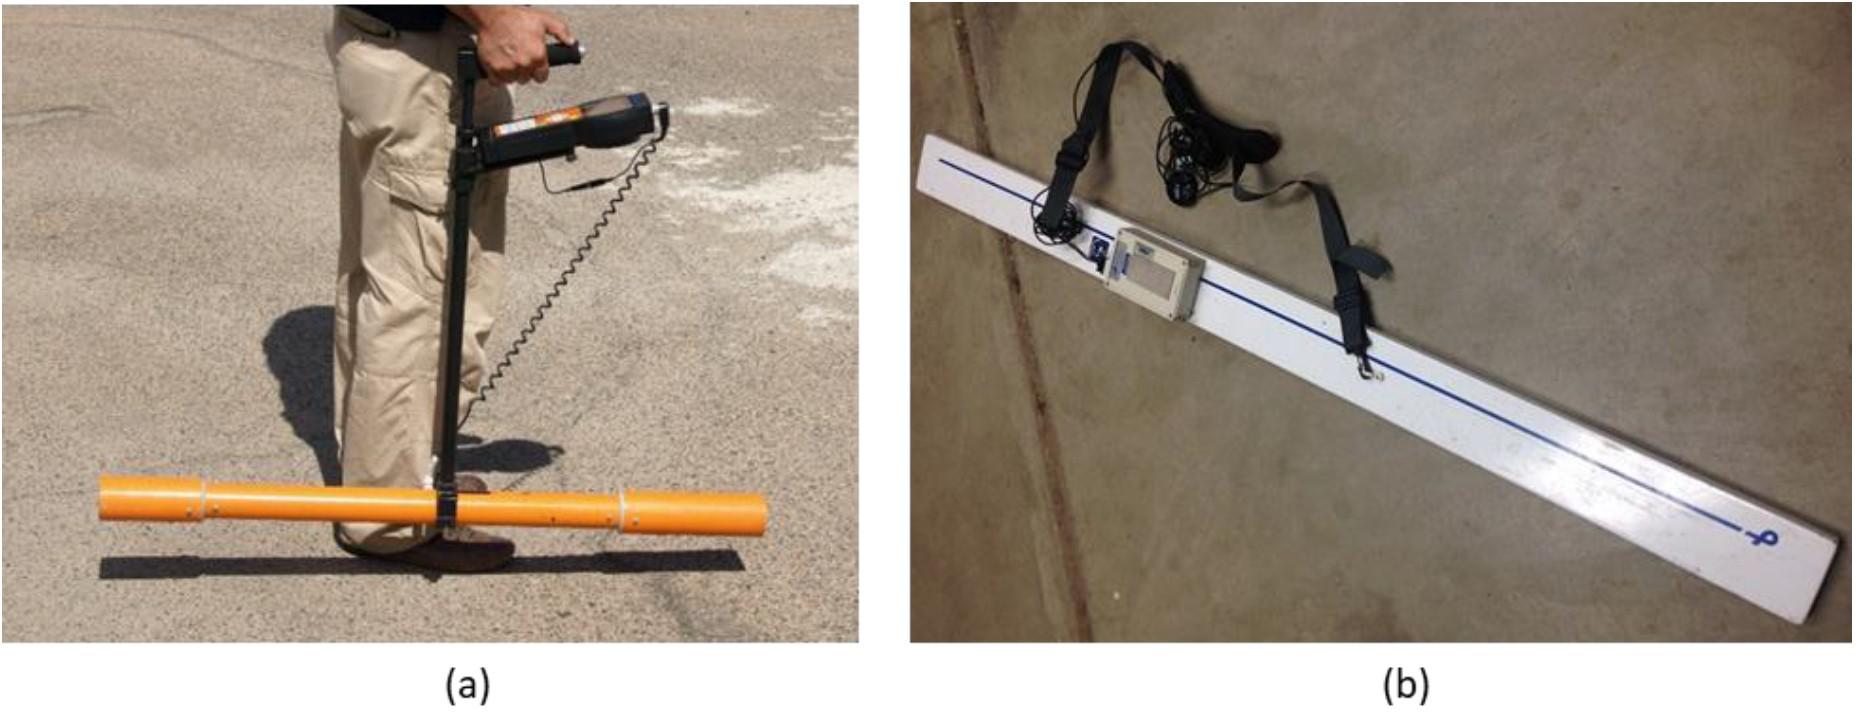
Electromagnetic data have been acquired with the Mini-Explorer electromagnetometer by GF Instruments (a) and the GEM2 electromagnetometer by Geophex (b).
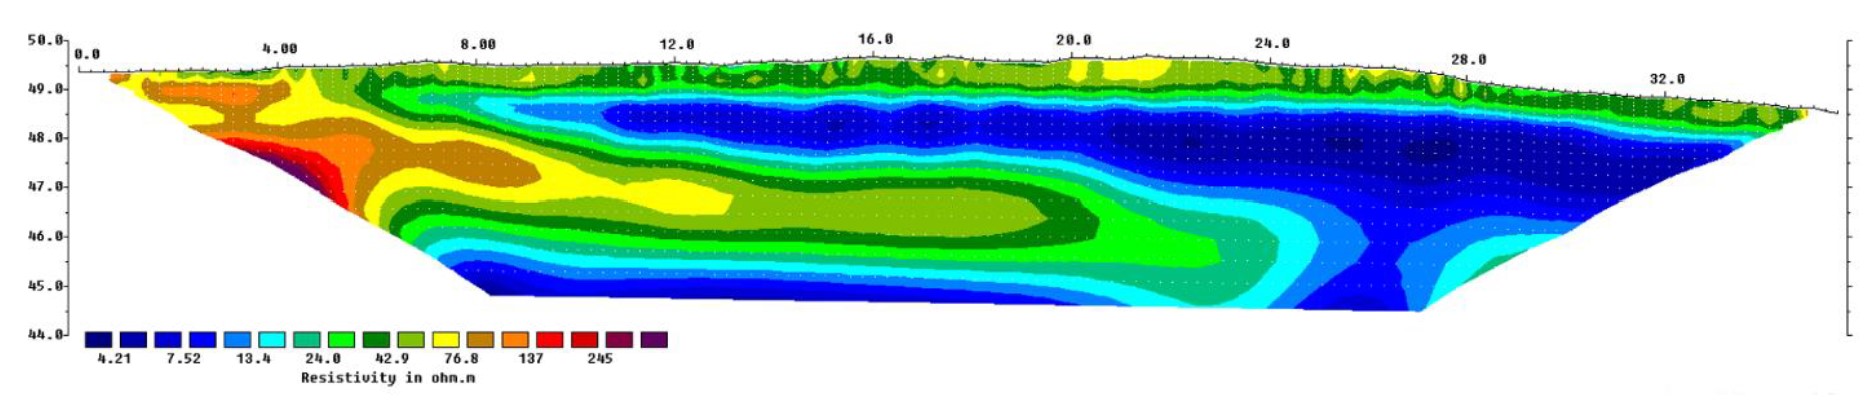
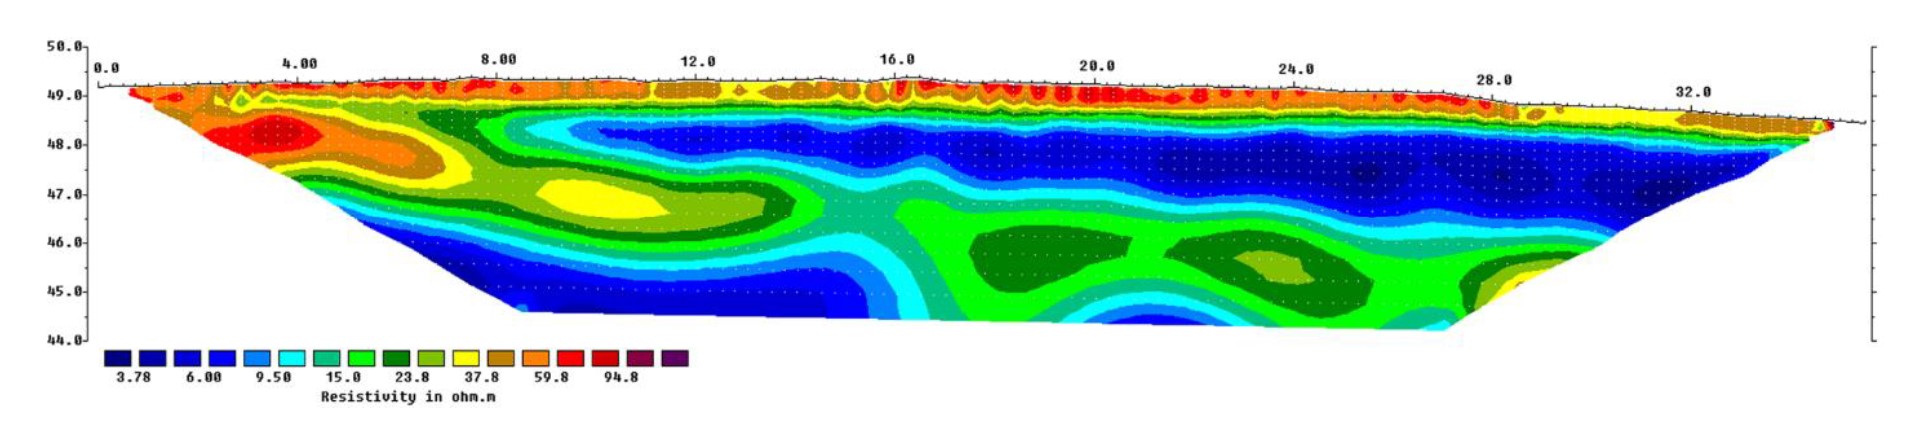
In the project We used Five frequencies, Their values were determined according to the electrical resistivity values obtained from the electrical tomographies acquired along the ERT_48_A and ERT_48_B lines. With both instruments, data have been acquired in successive steps over three areas A, B and C, along profiles of variable length and equispaced 1 m. The acquisition step along each profile was 4 measures/s, corresponding to approximately 4 measures/m. Both instruments have been transported at a height of 30 cm from the ground surface. Using the instruments with a differential GPS (Trimble 5800 GPS), UTM geographical coordinates were also measured for all measurement points. The following figures show the electrical resistivity tomographies taken along the ERT_48_A and ERT_48_B profiles.
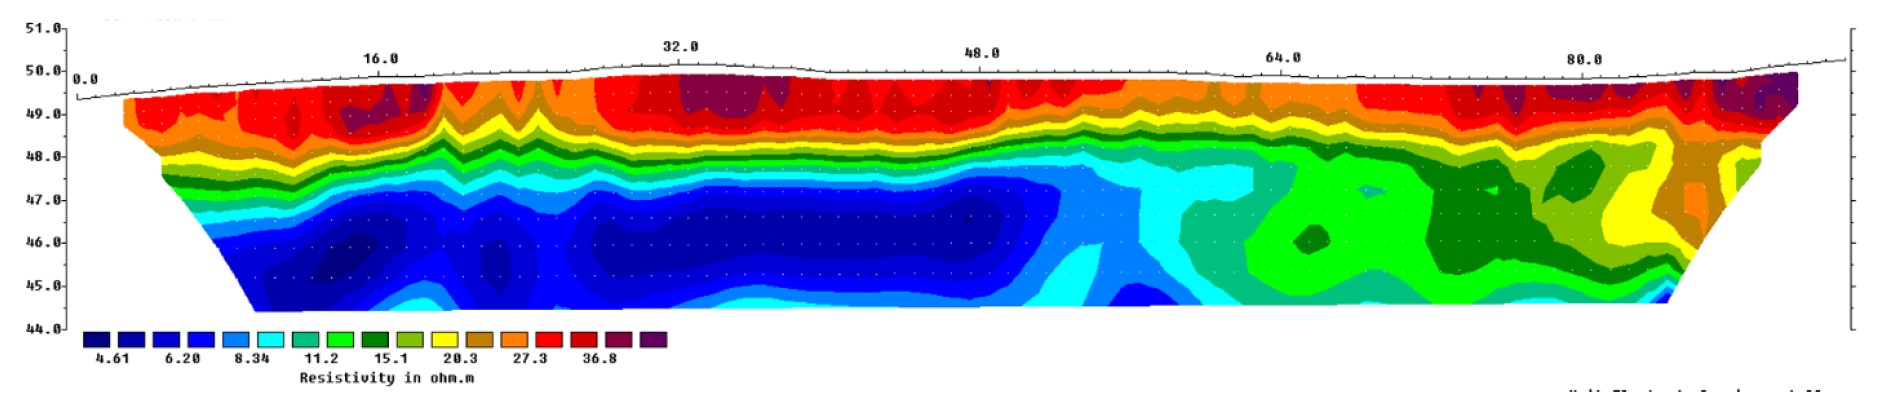
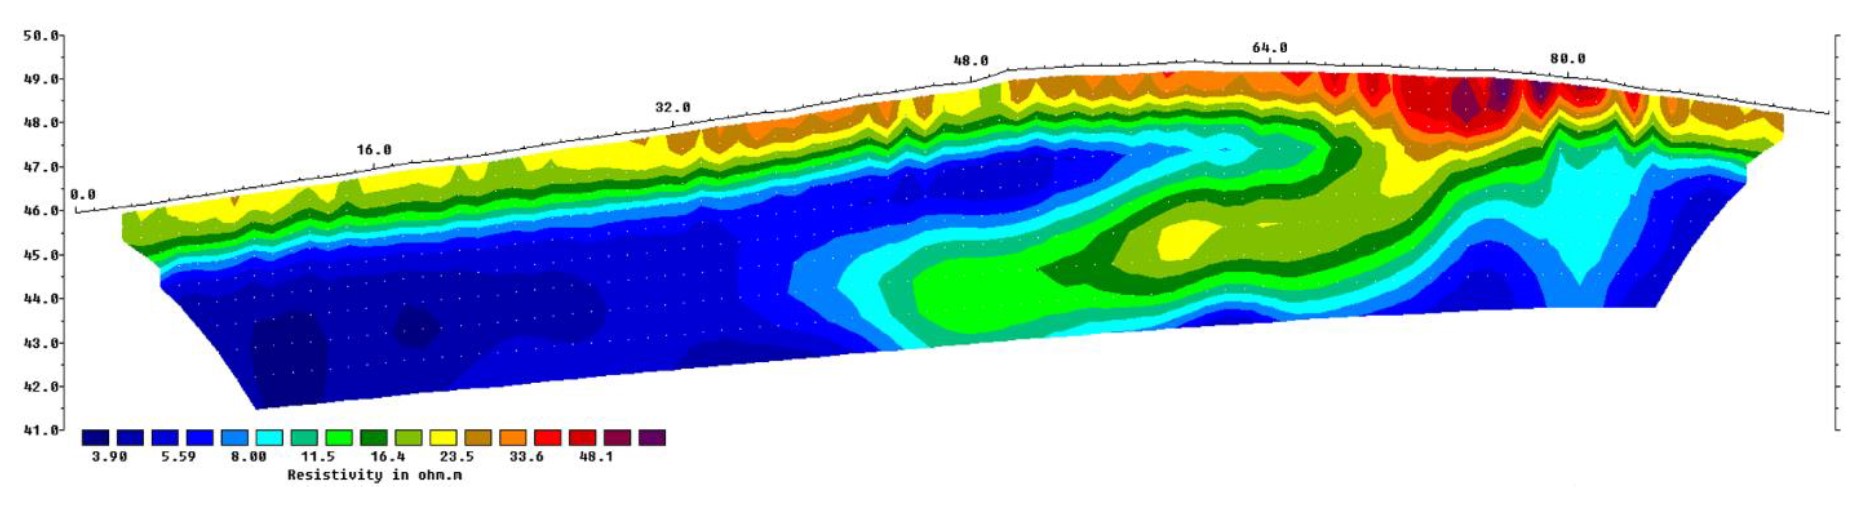
Both tomographies show electrical resistivity values between about 4 Ωm and 50 Ωm. With these resistivity values electromagnetic data were simulated by modifying the acquisition parameters in a wide range of values. From these simulations it was found that the electrical characteristics of the site were optimal for both instruments, MiniExplorer and GEM2.
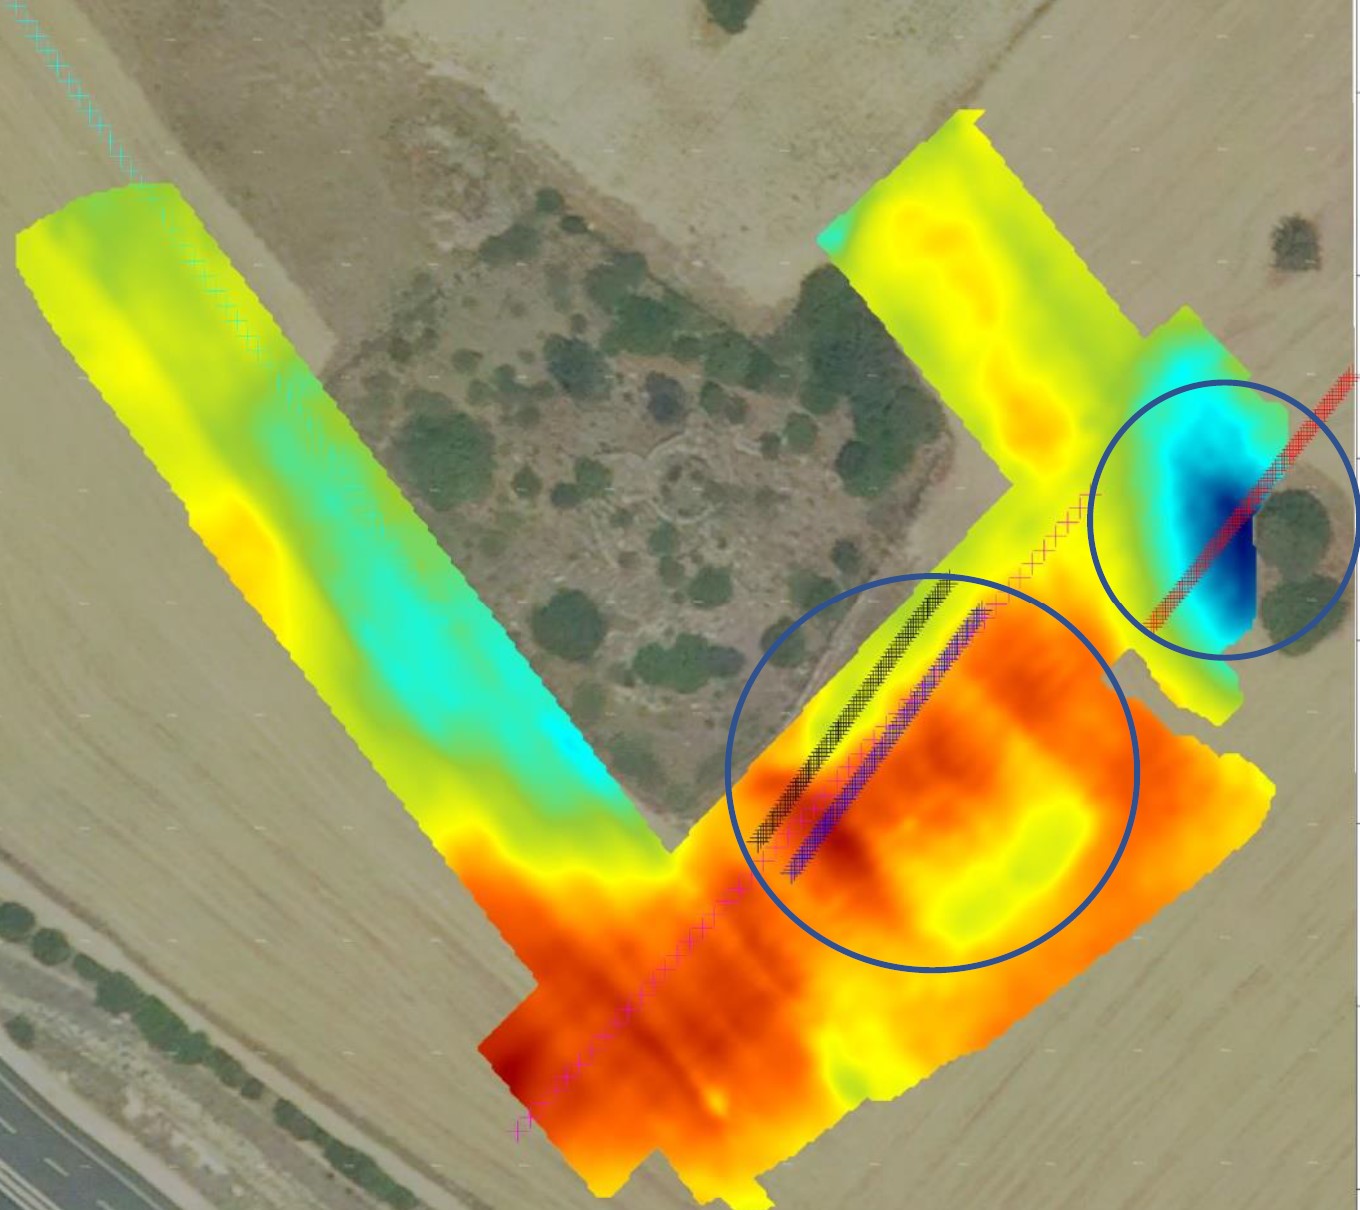
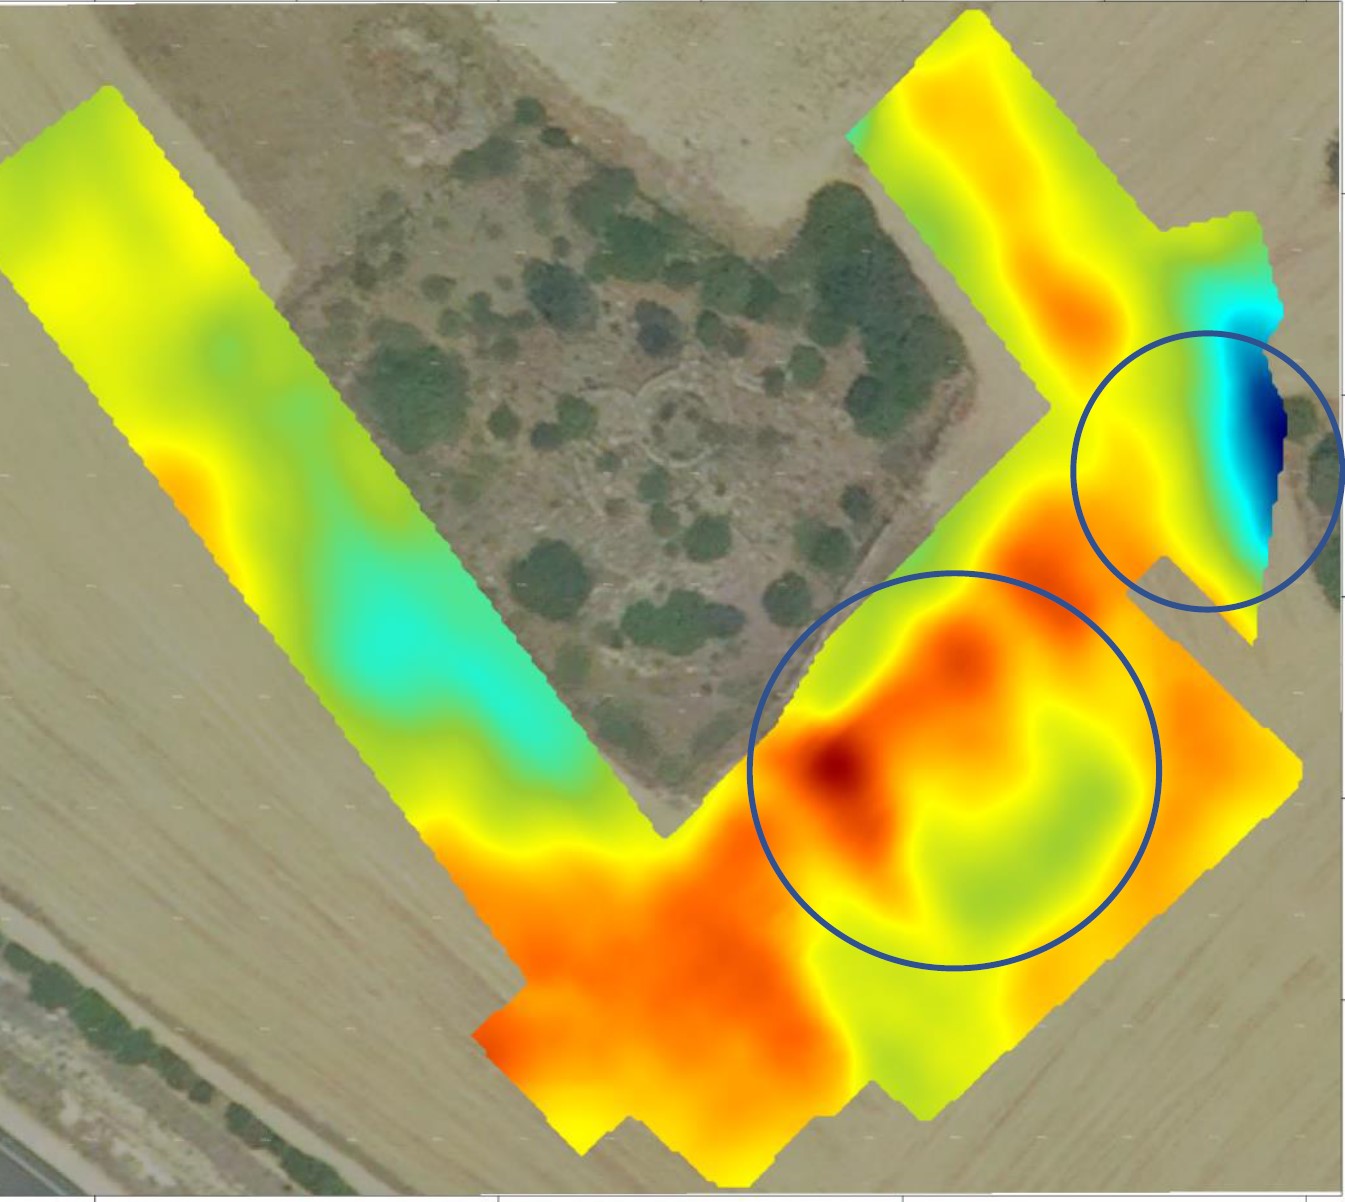
The following figures show the electromagnetic maps obtained with the data acquired with the MiniExplorer and GEM2 instruments, respectively. Both maps show some interesting anomalies, their location is highlighted with a blue circle.
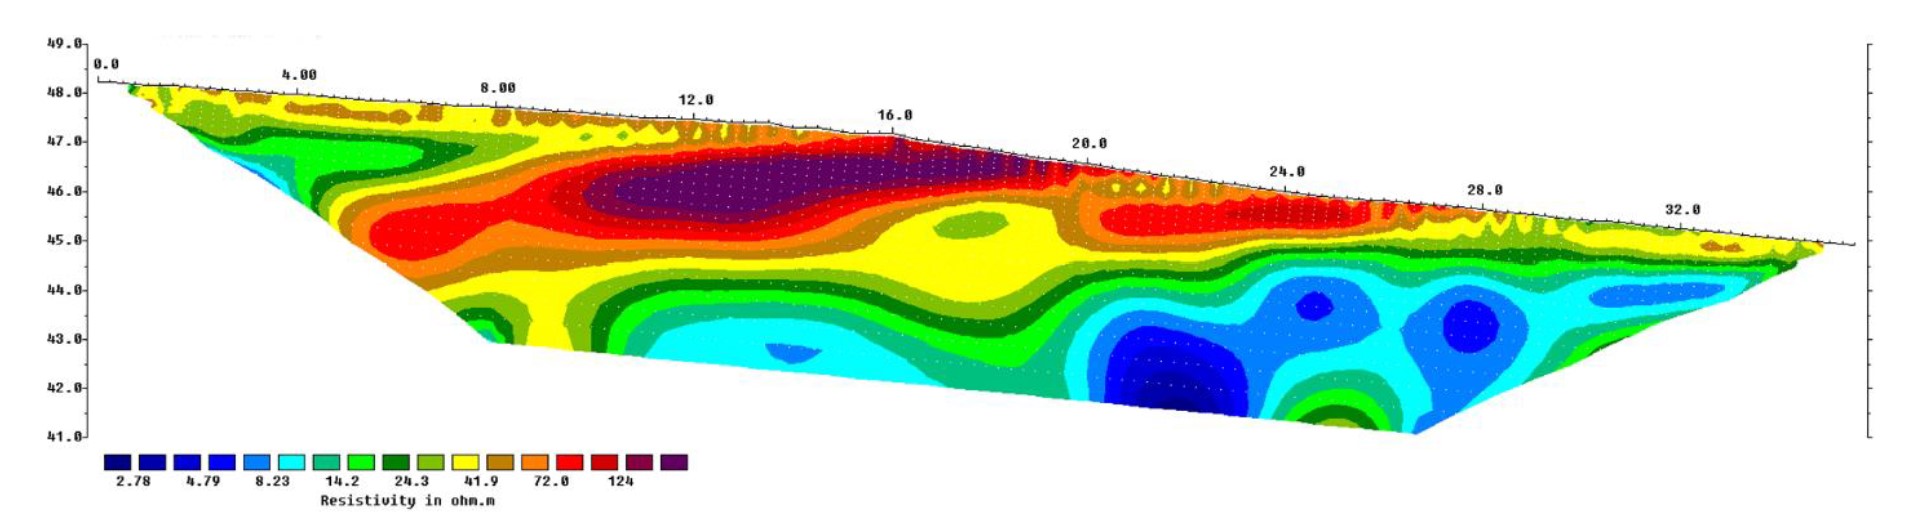
The following figures show the tomographies ERT_72_A, ERT_72_B e ERT_72_C